Lecture reflections
“They kept it simple, because that’s when design is at its best. Antoine de Saint-Expery said ‘A designer knows he has achieved perfection not when there is nothing left to add, but when there is nothing left to take away.’”
Lindon Leader (designer of the FedEx logo) said ‘I strive for two things in design: simplicity and clarity. Great design is born of those two things.’
Simplicity and clarity is of course favorable when working with data visualisation, but it is also from a western narrative of design? I do not agree that great design is born out of simplicity and clarity, such as Lindon Leader proclaims. As I think that is just the tone of voice of our western belief system on graphic design, it does not apply to graphic design globally. It is a narrow thought. Clean and minimalistic–as opposed to what? And why? It is that sort of thinking that gives someone the authority to deem certain design inferior. Constructing an unnecessary power relation within our field.
Further reflections on data visualisation
I wonder if information graphics in a way can be representative for the start of colonial logic within the field of graphic design? Going from the shift of the middle ages to the Renaissance, where man was put at at the center of knowledge instead of god, and then into the Enlightenment, where this knowledge and these thoughts were ordered, categorized, “The Scientific Method” was implemented, etc. The need for systematizing, separating and categorizing, principles existing within the essence of colonial logic, took its visual form in information graphics and data visualisation. And the visual fragments in the west at this time, served as the carriers and signifiers for this very logic. Sometimes I wonder if that logic lives on in the structures of our contemporary graphic design? The meticulous ordering with grids, spatial hierarchies, simplicity and clarity.
David McCandles—section not finished
Some quotes from McCandles talk I found valuable “It does not make any sense. The only way to understand it is visually and relatively.”
“Start having different relationships to the numbers” “see patterns and connections between numbers” “echoes through the group mind” (about columbine shooting-april)
“absolute figures in a connected world do not give the whole picture” – !we need relative figures that are connected to other data so we can see a fuller picture and then that can lead to us changing our perspective”
Challenge, Synopsis
Background and context
Let’s begin with a contextual analysis and set the premises of the origins of this map.
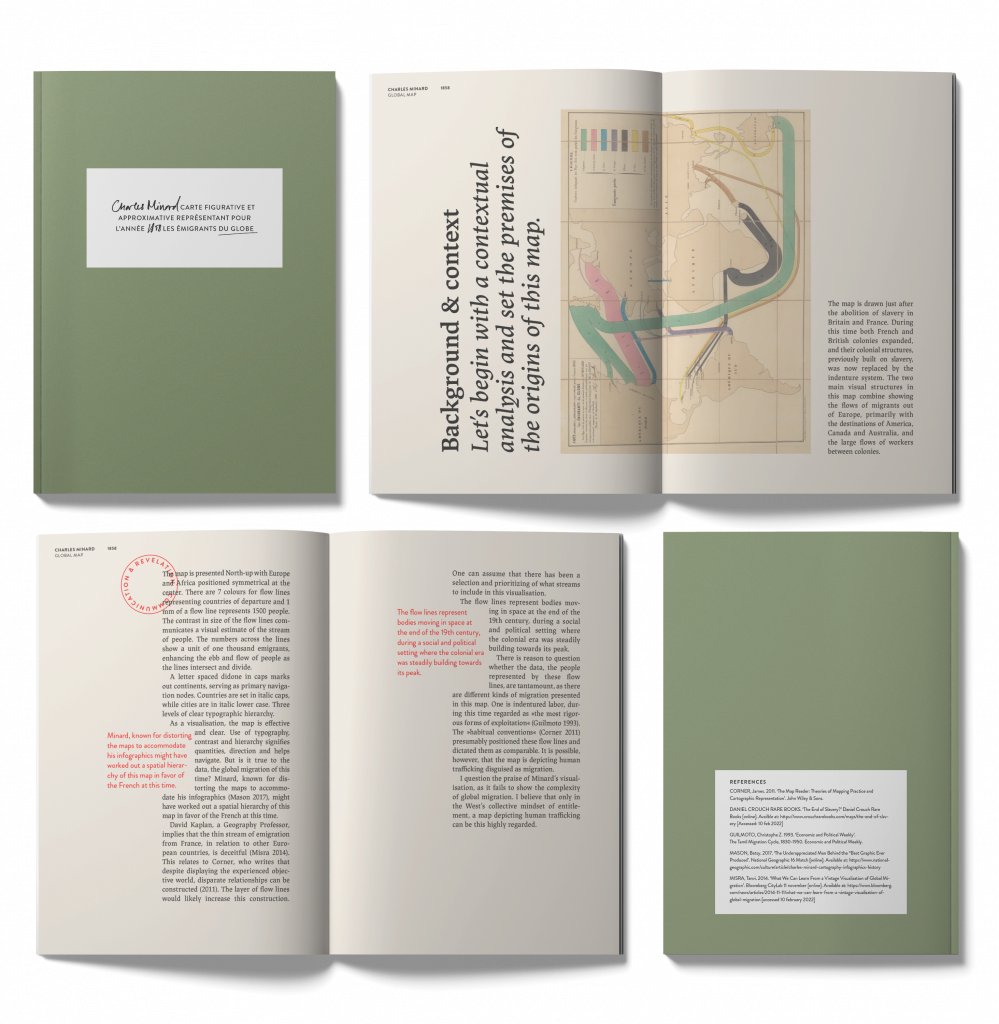
The map is drawn just after the abolition of slavery in Britain and France. During this time both French and British colonies expanded, and their colonial structures, previously built on slavery, was now replaced by the indenture system. The two main visual structures in this map combine showing the flows of migrants out of Europe, primarily with the destinations of America, Canada and Australia, and the large flows of workers between colonies.
Visual framework: communication and revelation
The map is presented North-up with Europe and Africa positioned symmetrical at the center. There are 7 colours for flow lines representing countries of departure and 1 mm of a flow line represents 1500 people. The contrast in size of the flow lines communicates a visual estimate of the stream of people. The numbers across the lines show a unit of one thousand emigrants, enhancing the ebb and flow of people as the lines intersect and divide.
A letter spaced didone in caps marks out continents, serving as primary navigation nodes. Countries are set in italic caps, while cities are in italic lower case. Three levels of clear typographic hierarchy.
As a visualisation, the map is effective and clear. Use of typography, contrast and hierarchy signifies quantities, direction and helps navigate. But is it true to the data, the global migration of this time? Minard, known for distorting the maps to accommodate his infographics, might have worked out a spatial hierarchy of this map in favor of the French at this time.
David Kaplan, a Geography Professor, implies that the thin stream of emigration from France, in relation to other European countries, is deceitful (Misra 2014). This relates to Corner, who writes that despite displaying the experienced objective world, disparate relationships can be constructed (2011). The layer of flow lines would likely increase this construction. One can assume that there has been a selection and prioritizing of what streams to include in this visualisation.
The flow lines represent bodies moving in space at the end of the 19th century, during a social and political setting where the colonial era was steadily building towards its peak.
There is reason to question whether the data, the people represented by these flow lines, are tantamount, as there are different kinds of migration presented in this map. One is indentured labor, during this time regarded as “the most rigorous forms of exploitation” (Guilmoto 1993). The “habitual conventions” (Corner 2011) presumably positioned these flow lines and dictated them as comparable. It is possible, however, that the map is depicting human trafficking disguised as migration.
I question the praise of Minard’s visualisation, as it fails to show the complexity of global migration. I believe that only in the West’s collective mindset of entitlement, a map depicting human trafficking can be this highly regarded.
Design development
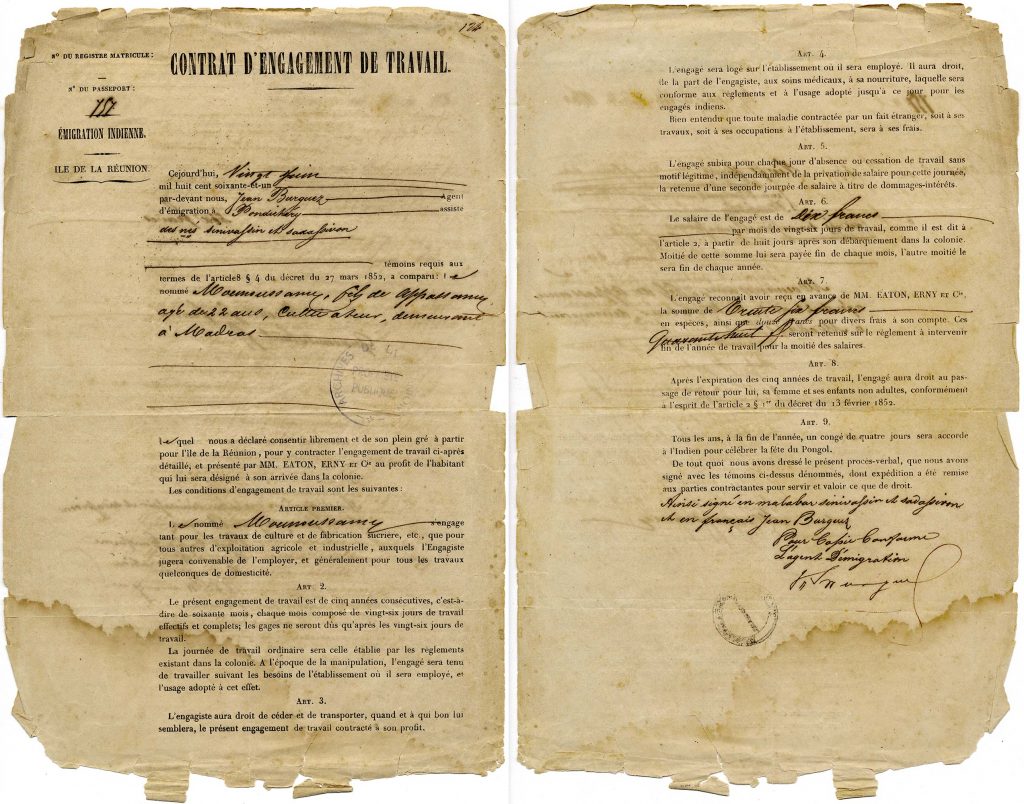
I am looking at a French indenture servitude for visual inspiration, year unknown. Quite tall format, generous left margins, ordered text, contrasting display typeface for heading. Handwritten signatures. Stamp. Yellow stained paper. Quite fragmented text, vertical space.
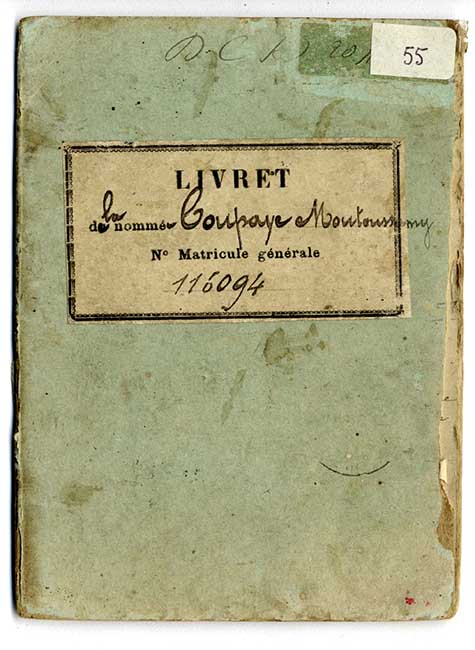
I am also looking at identity papers for indentured workers. Green book. Printed text + handwritten text. Sticker like thing in the optical midpoint of the book with information in it.

First sketch, echoing a lot of traits from my inspiration but looks very boring. A trifold? No. Need to find some more contemporary clothing for this interpretation.
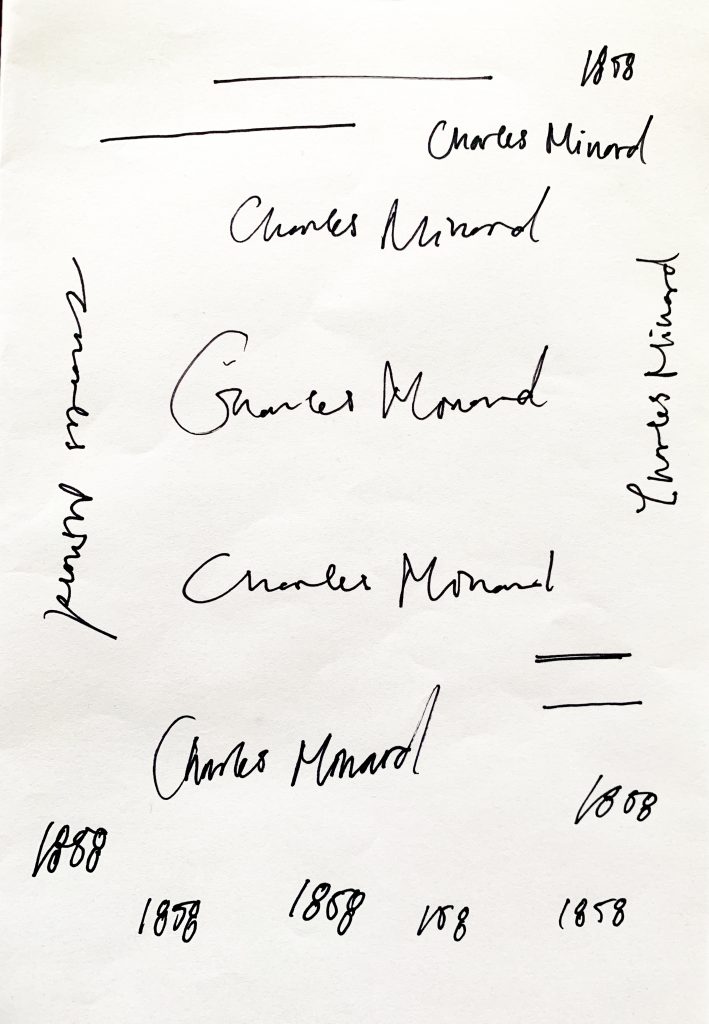
Started sketching for a magazine, knew that I wanted handwriting just like the id papers. Tried writing Charles Minard until I found a way that would fit my typography.
Final outcome
References
MISRA, Tanvi. 2014. ‘What We Can Learn From a Vintage Visualization of Global Migration’. Bloomberg CityLab 11 november [online]. Available at: https://www.bloomberg.com/news/articles/2014-11-11/what-we-can-learn-from-a-vintage-visualization-of-global-migration [accessed 10 february 2022]
DANIEL CROUCH RARE BOOKS. ‘The End of Slavery?’ Daniel Crouch Rare Books [online]. Availble at: https://www.crouchrarebooks.com/maps/the-end-of-slavery [Accessed: 10 feb 2022]
Corner, James. 2011. The Map Reader: Theories of Mapping Practice and Cartographic Representation. John Wiley & Sons.Guilmoto, Christophe Z. 1993. Economic and Political Weekly. The Tamil Migration Cycle, 1830-1950. Economic and Political Weekly.